Logging in AWS Lambda functions is simple. You just print the message, and it’s sent to the CloudWatch Logs. And everything is fine until you get a surprisingly big bill for the CloudWatch usage, or you need to actually debug some live system. Here are my tips for logging in AWS Lambda, based on my experience with real-live, big-scale functions running on production.
All prices below are given for the us-east-1 region.
They can be (much) higher in other regions.
Don’t log too much
Let’s start with thinking if you really need to log everything.
Logs ingestion to CloudWatch costs $0.50 per GB. Doesn’t seem much until you have a considerable production load.
To every log message you create, you must add ~70 bytes of metadata ingested with it – the timestamp and request ID. We can reduce it – more on this a bit later.
A single short message of 50 characters plus metadata gives us 1 GB of data for 8M logs. If you have 9 messages like this in a function that is called 10 times a second, it produces 1 GB of logs daily. This is $15 per month – not great, not terrible, but are you sure you need all this info, or you write it out of force of habit?
And those are calculations for relatively short logs. If you log a whole input event, be it an HTTP request content or Kinesis stream payload with up to 10,000 items, you can reach hundreds of dollars per month very easily.
Note on calculating log ingestion costs
Your own logs are not everything.
Every Lambda with CloudWatch permissions also creates START, END, and REPORT logs for every execution.
Those add extra ~340 bytes of log data ingested for every function invocation.

I saw a Lambda under a massive workload writing only those 3 built-in messages and generating several hundreds of gigabytes of logs monthly.
Use log levels
Costs are one thing, but we need the ability to debug our Lambdas. Fortunately, the solution is old and well-known.
Like with any other app, don’t just write logs as output text.
Use one of the dozens of existing logging libraries for every language and write logs with severity levels like DEBUG, INFO, WARN, ERROR, etc.
Then set the log level accordingly to the environment/stage on which your function runs. Simple config I use in Serverless Framework:
custom:
  logLevelMap:
    prod: info
    staging: info
  logLevel: ${self:custom.logLevelMap.${opt:stage}, 'debug'}

provider:
  environment:
    LOG_LEVEL: ${self:custom.logLevel}
const logger = someLoggerLib.createLogger({
  level: process.env.LOG_LEVEL || 'info',
});
That sets the log level to “info” on prod and staging environments and “debug” on any other, like development environments. This way, I get full logs during the development on my low-traffic environment(s) and only the most essential ones on the production.
As a bonus, you can quickly change the LOG_LEVEL value in your Lambda settings on production to get additional logs instantaneously in case of troubles.
No re-deployment is needed.
Set log retention
You probably won’t ever need to look at logs older than one month anyway, so don’t pay for storing them.
Logs storage costs $0.03 per GB. Storage is cheap, but why not minimize the costs?
Especially that the setup in Serverless Framework is dead simple:
provider:
  logRetentionInDays: 30
Now the CloudWatch will automatically remove for you logs older than 30 days.
There is also a second advantage of setting up the log retention. It may be that you accidentally put in logs something confidential. With log retention, you at least delete older data, minimizing the potential damage. Of course, I hope I don’t have to tell you that this is not a solution that makes writing sensitive data in logs okay.
Note on calculating log storage costs
Stored logs size will not be equal to the ingested logs size. As stated in the pricing calculator:
Log volume archived is estimated to be 15% of Log volume ingested (due to compression)
Log as JSON
CloudWatch Logs understands and parses JSON. That gives us a lot of power to filter and analyze the logs.
Let’s say that, instead of plain string messages, we have logs looking like this:
{
  "level": "info",
  "message": "Data ingest completed",
  "data": {
    "items": 42,
    "failures": 7
  }
}
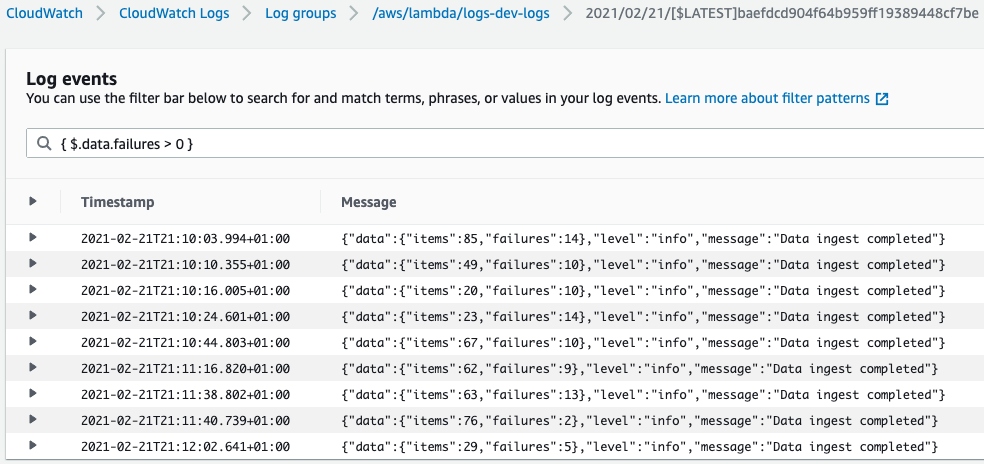
Now in the CloudWatch Logs log stream events view, we can easily find only the logs with that message by providing a filter:
{ $.message = "Data ingest completed" }
Or find only the log message for ingestion jobs that had some failures:
{ $.data.failures > 0 }
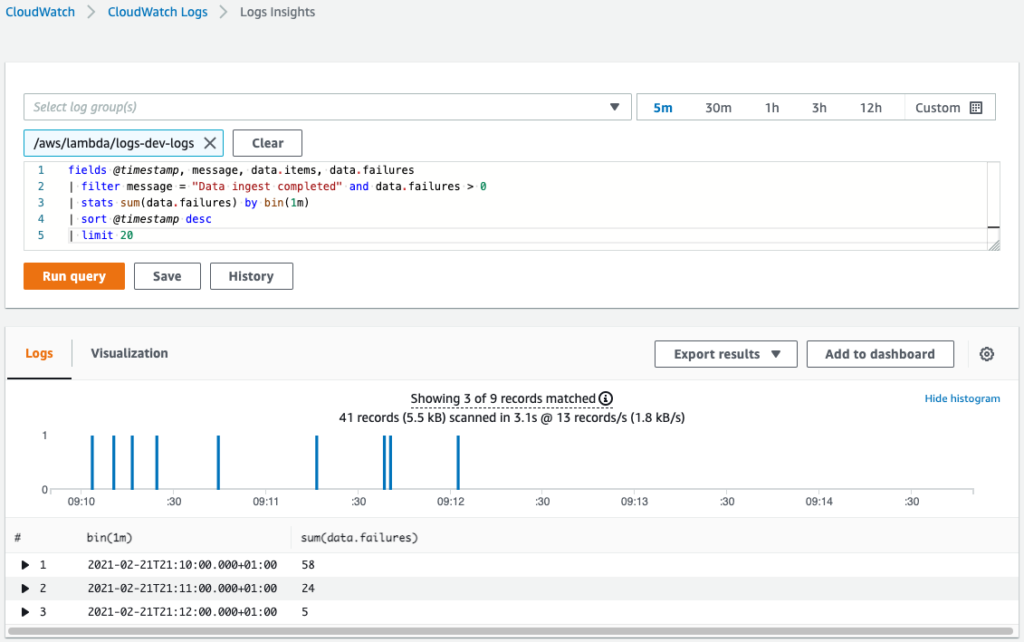
Moreover, in the CloudWatch Logs Insights, we can do all sorts of operations with logged data. For example, count the total number of failures each minute:
fields @timestamp, message, data.items, data.failures
| filter message = "Data ingest completed" and data.failures > 0
| stats sum(data.failures) by bin(1m)
| sort @timestamp desc
| limit 20
Log request ID
Now you log only the necessary information, and you can easily filter it. Thanks to this, when something bad happens on the production, you can find the proper log in seconds.
But a single log message is not enough. To debug a problem, you need to know what happened from the beginning of Lambda’s execution. Filtering by time is not the right approach here, as logs from multiple concurrent executions would be mixed up.
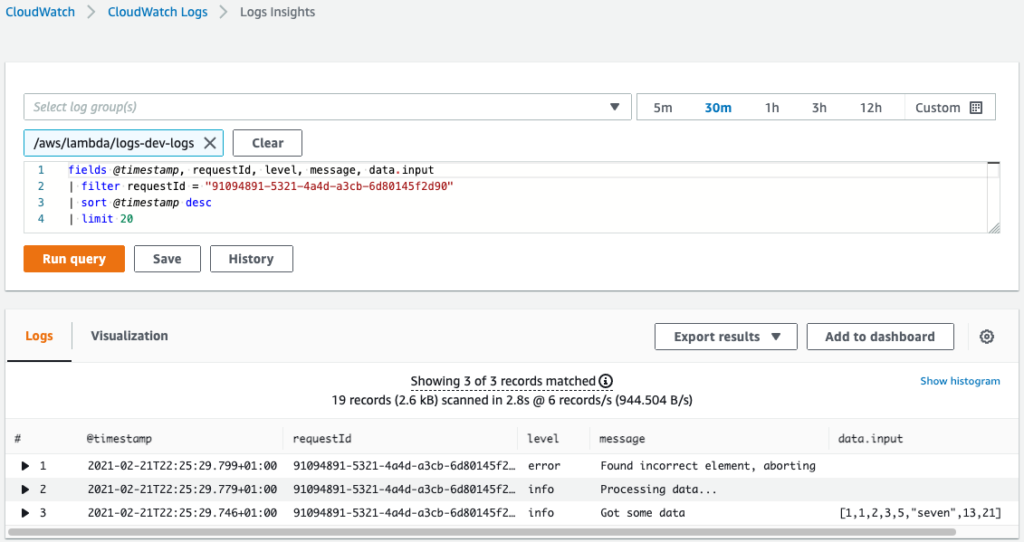
To overcome this, you can add a request ID to all the logs written in the function. The request ID is a unique identifier available in the invocation context object.
With request ID in every log message, finding all logs from a particular execution is simple. When you have a single log, you take the request ID from it and use it as a filter to get all messages from the given invocation.
In Node, if your logger uses console.log() to write to the output, the request ID will be prepended automatically to the log messages.
But if you write to the output stream directly with process.stdout.write, you need to add the request ID to the log by yourself.
An advantage of writing directly to the output stream is that the log message does not contain a timestamp and the default level mark (“INFO”). The log timestamp is saved anyway, so it’s redundant in text. We specify the custom severity level in the message. This way, we save around 20 bytes per message. Sounds like micro-optimization, but on the scale, this can make a difference.
Best if your logger provides a way to set metadata that it will automatically write with every log. This way, you can just set it up at the beginning of the Lambda handler:
export handler = async (event, context) => {
    setupLogger(context.awsRequestId);

    // ...
};
Simple logger config
Let’s end with a logger setup for Lambda functions. In Node, we can use a popular winston library. This is how we configure it to log:
- on a level provided by an environment variable
- as JSON
- with request ID attached to every message
- and with optional additional data
import winston from 'winston';

const logger = winston.createLogger({
    level: process.env.LOG_LEVEL || 'info',
    format: winston.format.json(),
    transports: [
        new winston.transports.Console(),
    ],
});

export const handler = async (event, context) => {
    logger.defaultMeta = {requestId: context.awsRequestId};

    logger.info('Your log here', {data: 42});
};
Summary
That’s all folks about best practices for logging in AWS Lambda. Did I miss anything? Would you add something to it? If so, let me know in the comments.
- 📨 algorithm-independent information about new posts
- 📘 my ebook about Serverless on AWS
- ✅ zero spam
Unsubscribe anytime.
Unsubscribe anytime.